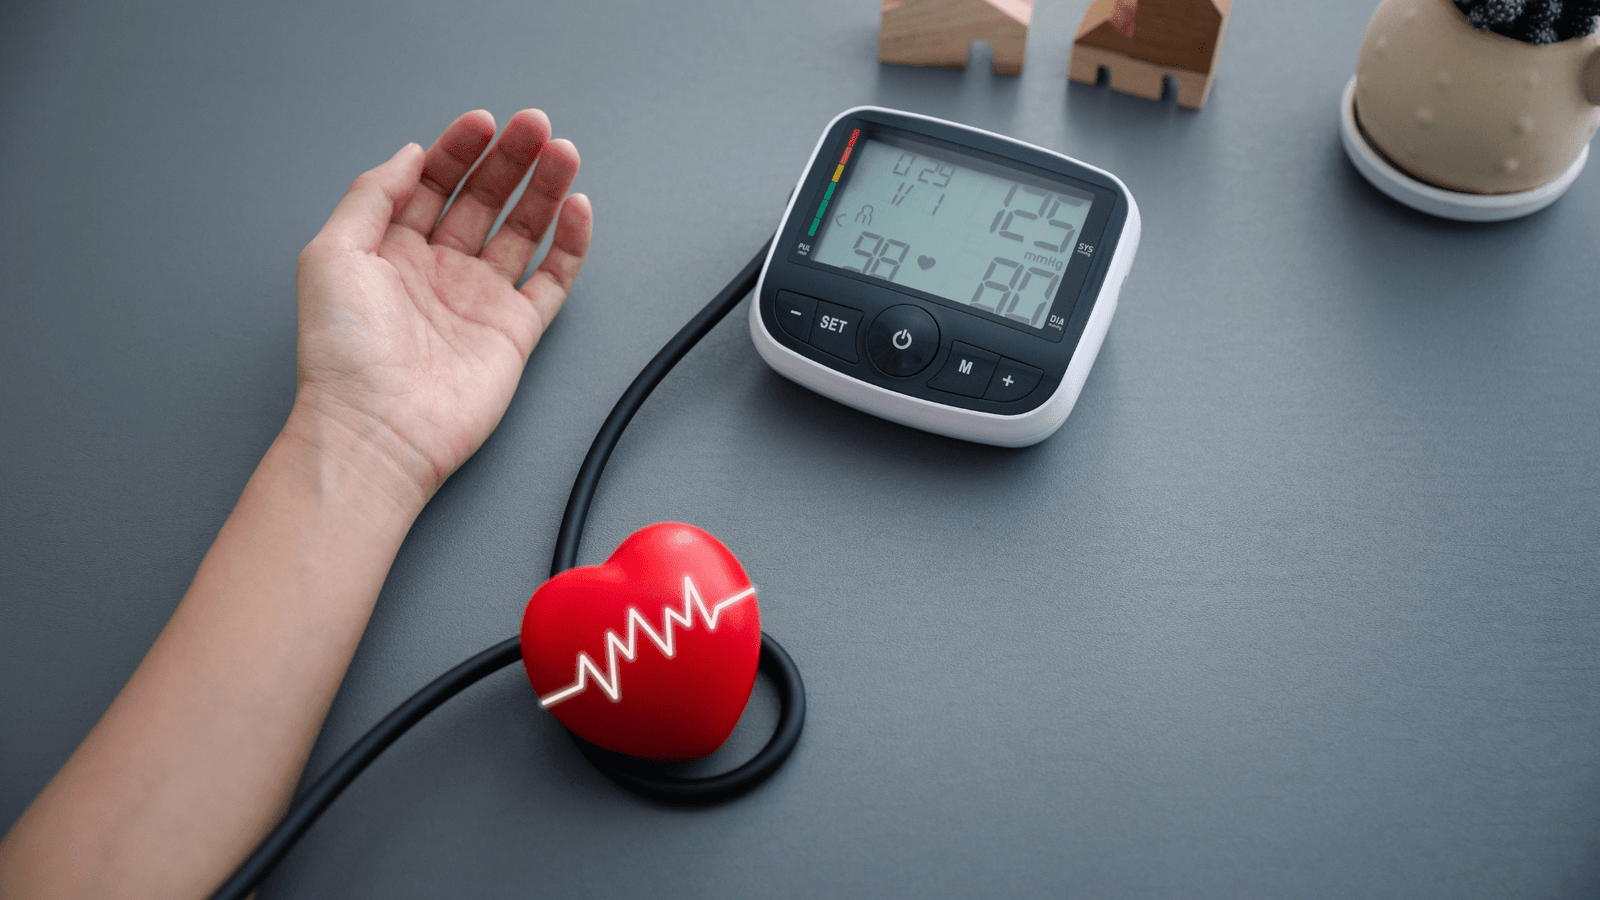
You walked out of your doctor’s office feeling great. Blood pressure: 118/76. “Textbook perfect,” your physician said with a smile. You nodded, relieved, and filed away the memory of that visit somewhere between “things not to worry about” and “proof that you’re doing fine.”
But here’s what nobody told you about that moment: blood pressure is a lagging indicator. It rises after arterial damage has already accumulated — sometimes decades after the process begins. By the time your cuff readings start climbing, your arteries may have already been narrowing quietly, steadily, for years.
This is not a scare tactic. This is cardiovascular physiology, and understanding it could genuinely save your life.
The real story of your arterial health is written not in your blood pressure reading, but in the deeper numbers hiding in your standard bloodwork — numbers that most patients never ask about and that some physicians, pressed for time, rarely explain. If you’ve had a recent comprehensive metabolic panel or lipid panel drawn, there’s a good chance the evidence is already sitting in your patient portal, waiting to be interpreted.
Let’s decode it.
Why Blood Pressure Misses the Early Warning Window
The cardiovascular system is remarkably adaptive. Your heart and arteries can compensate for early plaque buildup, endothelial inflammation, and arterial stiffening for a surprisingly long time before blood pressure numbers reflect any of it. The arterial walls stretch, the heart pumps a little harder, and the body quietly redistributes blood flow to maintain equilibrium.
Atherosclerosis — the technical term for the progressive narrowing and hardening of arteries due to plaque accumulation — typically begins in the teenage years for many Americans. By the time someone reaches their 40s or 50s, the process in many cases is not just beginning; it’s well underway. The Bogalusa Heart Study, a landmark long-term research project tracking cardiovascular risk factors from childhood into adulthood, found fatty streaks in the arteries of young adults who had no clinical symptoms whatsoever.
Blood pressure often doesn’t rise meaningfully until a significant portion of arterial flexibility is already lost. That window between “early arterial damage” and “elevated blood pressure” is exactly where these seven blood markers live — and where catching the problem early makes the most dramatic difference.
1. Your LDL Particle Number (LDL-P), Not Just LDL-C
Most standard lipid panels report LDL cholesterol concentration, commonly called LDL-C. Your doctor sees a number like 110 mg/dL and considers it acceptable. But cholesterol concentration and cholesterol particle count are not the same thing, and this distinction is one of the most underappreciated gaps in routine cardiac screening.
LDL-P measures how many LDL particles are circulating in your blood, regardless of how much cholesterol each particle carries. Research published in leading cardiology journals, including work from the MESA (Multi-Ethnic Study of Atherosclerosis) trial, has consistently shown that LDL-P is a stronger predictor of cardiovascular events than LDL-C. You can have a perfectly “normal” LDL-C of 100 mg/dL while carrying an elevated particle count — meaning more small, dense LDL particles are available to infiltrate artery walls and initiate plaque formation.
To get this number, ask your doctor for an NMR LipoPro file or an advanced lipid panel. The optimal LDL-P for low cardiovascular risk is generally considered to be below 1,000 nmol/L. Many Americans walking around with “normal” cholesterol panels are carrying particle counts well above 1,400.
2. Small, Dense LDL Particles (sdLDL)
Staying in the lipid world for a moment, because this one deserves its own entry: not all LDL is created equal. The size and density of LDL particles matters enormously for arterial health.
Large, buoyant LDL particles are relatively benign. They circulate, do their job of transporting cholesterol to cells, and are cleared by the liver efficiently. Small, dense LDL particles, on the other hand, are oxidation-prone, more likely to slip through gaps in endothelial cells, and significantly more likely to become embedded in arterial walls where they trigger the inflammatory cascade that builds plaque.
The pattern of small, dense LDL — sometimes called Pattern B dyslipidemia — is frequently associated with metabolic syndrome, insulin resistance, and diets high in refined carbohydrates. Ironically, it’s the dietary pattern most likely to produce a “normal” total cholesterol number while simultaneously elevating cardiovascular risk. A standard lipid panel will completely miss this. An NMR or advanced lipid fractionation test will catch it immediately.
3. High-Sensitivity C-Reactive Protein (hs-CRP)
Inflammation is the engine of atherosclerosis. Plaque doesn’t just accumulate passively like sediment in a pipe — it grows in response to chronic vascular inflammation. Oxidized LDL particles in artery walls trigger an immune response, macrophages rush in to engulf them, and the resulting “foam cells” form the fatty core of arterial plaques.
High-sensitivity C-reactive protein (hs-CRP) is a blood marker of systemic inflammation produced by the liver in response to inflammatory signals. It’s not specific to the arteries — elevated hs-CRP can reflect any inflammatory process — but its connection to cardiovascular risk has been extensively validated.
The landmark JUPITER trial, a randomized controlled study involving nearly 18,000 participants published in the New England Journal of Medicine, found that individuals with normal LDL cholesterol but elevated hs-CRP had significantly reduced cardiovascular events when treated with statin therapy. In other words, hs-CRP was identifying risk that LDL alone was missing.
An hs-CRP below 1.0 mg/L is considered low cardiovascular risk. Between 1.0 and 3.0 mg/L is moderate risk. Above 3.0 mg/L is high risk (when infection or other inflammatory causes have been ruled out). Many patients with perfect blood pressure readings are carrying hs-CRP values of 4.0, 5.0, or higher — their arteries inflamed and actively building plaque while their cuffs report all clear.
4. Lipoprotein(a) — The Genetic Wildcard
This one is deeply underdiagnosed in the United States, and the medical community is only beginning to fully appreciate how significant it is. Lipoprotein(a), written as Lp(a) and pronounced “L-P-little-a,” is a modified form of LDL cholesterol with an additional protein called apolipoprotein(a) attached. It is almost entirely genetically determined — diet and exercise have minimal influence on it — and it is present in elevated levels in approximately 20 percent of the U.S. population.
Elevated Lp(a) is independently associated with increased risk of heart attack, stroke, aortic valve disease, and peripheral artery disease. It is atherogenic (promotes plaque buildup), pro-inflammatory, and thrombogenic (promotes clotting). Most standard lipid panels do not test for it. Many physicians never order it. Patients carry elevated Lp(a) for decades without knowing, accumulating arterial damage that their standard bloodwork cheerfully ignores.
A single Lp(a) test is recommended at least once in adulthood by the European Atherosclerosis Society and increasingly supported by U.S. cardiology guidelines. An Lp(a) above 50 mg/dL (or 125 nmol/L, depending on the assay used) is generally considered elevated and warrants closer cardiovascular monitoring and more aggressive management of other modifiable risk factors.
If you have a family history of early heart disease — a parent or sibling who had a heart attack before age 55 — getting your Lp(a) tested is not optional. It’s essential.
5. Fasting Insulin and HOMA-IR
Here’s a number almost no one orders on routine bloodwork, despite its remarkable predictive power: fasting insulin. Most physicians check fasting glucose to screen for diabetes, but fasting glucose rises late in the process of insulin resistance — after years of the pancreas compensating by producing more and more insulin to keep blood sugar in range.
Fasting insulin, and the calculated ratio called HOMA-IR (Homeostatic Model Assessment of Insulin Resistance), catches insulin resistance years before blood glucose starts climbing. And insulin resistance is one of the most powerful drivers of cardiovascular disease in Americans today. It promotes inflammation, raises triglycerides, lowers HDL cholesterol, drives the production of small dense LDL particles, and directly damages endothelial cells — the fragile single-cell lining of your arteries that, when healthy, acts as a protective barrier against plaque formation.
A fasting insulin below 5 uIU/mL is generally associated with good insulin sensitivity. Values above 10 to 15 uIU/mL, even with normal blood glucose, suggest meaningful insulin resistance. A HOMA-IR above 2.0 is considered elevated by most functional medicine practitioners and an increasing number of preventive cardiologists.
This is the sleeper marker that sits in the gap between “your blood sugar is fine” and “your arteries are quietly paying the price of metabolic dysfunction.”
6. Triglyceride-to-HDL Ratio
This one you can calculate yourself from a standard lipid panel, and it’s arguably one of the most informative numbers on the entire page. Divide your fasting triglyceride value by your HDL cholesterol value.
A ratio below 2.0 is generally considered favorable. A ratio above 3.0 — particularly above 4.0 — is a strong indicator of insulin resistance, small dense LDL dominance, and elevated cardiovascular risk. In research populations, a high triglyceride-to-HDL ratio has been shown to correlate with the presence of arterial plaque more reliably than LDL cholesterol alone.
The metabolic pattern that produces a high ratio — elevated triglycerides combined with low HDL — is the fingerprint of a carbohydrate-driven dyslipidemia: the type produced by diets heavy in refined sugars, ultra-processed foods, and excess refined carbohydrates. It’s the dietary pattern most common in America, and it produces a lipid profile that looks almost benign on a surface reading while hiding significant vascular risk in the details.
If your triglycerides are 180 and your HDL is 42, your ratio is 4.3. Your total cholesterol might be perfectly “normal.” Your LDL-C might be fine. But the ratio tells a different story — one that warrants attention and intervention.
7. Homocysteine
Homocysteine is an amino acid produced naturally in the body as a byproduct of metabolizing methionine, which is found in protein-rich foods. Normally, homocysteine is quickly converted into harmless byproducts with the help of B vitamins — specifically B6, B12, and folate. When those vitamins are deficient, or when genetic variants in the MTHFR gene impair this conversion, homocysteine accumulates in the blood.
Elevated homocysteine is directly toxic to endothelial cells. It impairs nitric oxide production (nitric oxide is the molecule that keeps arteries flexible and dilated), promotes oxidative stress, increases LDL oxidation, and accelerates both atherosclerosis and thrombosis. Research has consistently linked elevated homocysteine to increased risk of coronary artery disease, stroke, and peripheral vascular disease.
Optimal homocysteine is generally considered to be below 9 to 10 micromol/L. Values above 12 to 15 micromol/L are considered elevated. Many Americans — particularly those who are vegetarian or vegan without adequate B12 supplementation, those on long-term metformin therapy (which depletes B12), and those with MTHFR variants — carry elevated homocysteine without knowing it.
The good news: elevated homocysteine due to nutritional deficiency is among the most correctable of all cardiovascular risk markers. A course of methylated B vitamins (methylfolate and methylcobalamin) often brings homocysteine down meaningfully within weeks. But you can’t fix what you haven’t measured.
What to Do With This Information
Understanding these markers is the first step; acting on them is what matters. Here’s how to move forward practically.
Request the right tests. At your next annual physical or preventive care visit, specifically ask your physician for: an NMR LipoProfile or advanced lipid fractionation (for LDL-P and particle size), hs-CRP, Lp(a) (at least once), fasting insulin, and homocysteine. Most of these are available through standard commercial labs like Quest or LabCorp. Some may require a specific request or may not be covered by all insurance plans without a supporting clinical indication — but many are affordable out-of-pocket, often ranging from $20 to $60 per test.
Contextualize, don’t catastrophize. One elevated marker in isolation rarely tells the whole story. A cardiovascular risk assessment considers the constellation of markers together, along with family history, lifestyle factors, age, and other clinical information. If several of these markers are trending in the wrong direction simultaneously, that’s a meaningful signal worth discussing seriously with a cardiologist or preventive medicine specialist.
Lifestyle remains the most powerful intervention. The arterial damage process is modifiable at every stage. Regular aerobic exercise improves endothelial function, raises HDL, lowers triglycerides, reduces hs-CRP, and improves insulin sensitivity — sometimes dramatically. A diet low in ultra-processed foods and refined carbohydrates, rich in vegetables, quality proteins, and healthy fats, addresses multiple markers simultaneously. Adequate sleep, stress management, and avoiding smoking complete the picture. No medication addresses all seven of these markers at once; lifestyle comes closest.
Find a physician who practices preventive cardiology. Not all primary care physicians are equally up to date on advanced lipid testing and cardiovascular biomarker interpretation. If your doctor is dismissive of these concerns when your “basic numbers look fine,” it may be worth seeking a consultation with a preventive cardiologist or a functional medicine physician who specializes in cardiovascular risk. Your heart doesn’t care whether your last appointment ran on schedule.
The Bigger Picture
Cardiovascular disease kills more Americans than any other condition — approximately 700,000 people per year, according to the CDC. A staggering proportion of those deaths occur in people who had no dramatic warning signs in the months or years before their event. Many of them had blood pressure readings their doctors called perfect.
The science of cardiovascular prevention has advanced considerably beyond the blood pressure cuff and the basic cholesterol panel. The tools to detect early arterial disease exist, they are accessible, and they are increasingly affordable. The gap between what is possible in preventive cardiovascular medicine and what routinely happens in a standard 15-minute annual physical is one of the most consequential gaps in American healthcare.
You don’t have to wait for symptoms. You don’t have to wait for your blood pressure to climb. The story of your arterial health is already being written in your bloodwork — in the numbers your doctor may not have flagged, in the ratios no one calculated, in the markers that never made it onto the standard order sheet.
Ask the questions. Request the tests. Understand your numbers. Because a blood pressure of 118/76 is genuinely wonderful — and it is also entirely compatible with arteries that are quietly, silently, steadily narrowing.
The best time to find out is before you feel anything at all.
This article is intended for informational and educational purposes only and does not constitute medical advice. Always consult a qualified healthcare professional before making changes to your health management plan or requesting specific diagnostic tests.

Omisha is a health writer passionate about turning complex medical research into clear, actionable content readers can trust. She covers everything from nutrition and mental wellness to chronic disease management, always grounding her work in credible science and real-world relevance. When she's not writing, she's usually reading up on the latest health studies or exploring new wellness trends to write about next.